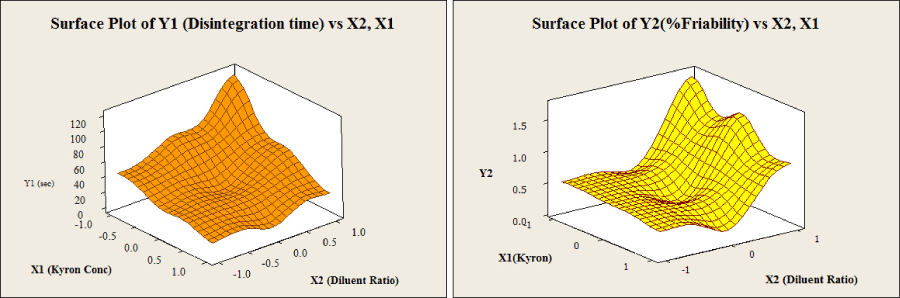
Figure 13:
Right:
Response Surface Plot of Y
1
vs. X
1
and X
2
;
Left:
Response Surface Plot of Y
2
vs X
1
and X
2
.