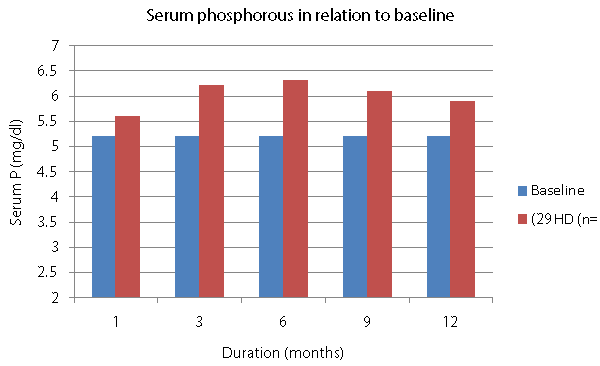
Figure 4:
Mean serum phosphate levels of HD group compared to baseline depicted in bar diagram (p=0.003).