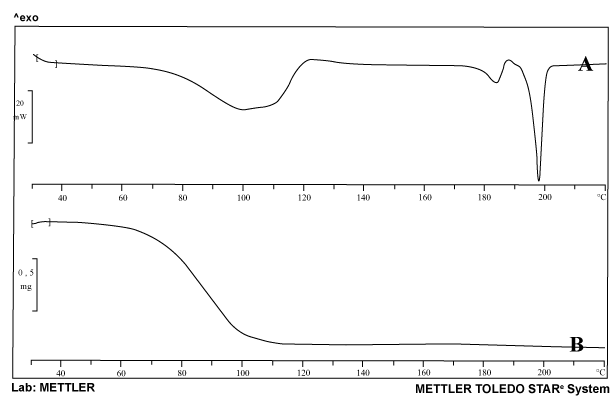
Figure 7:
Thermogram (A) and thermogravimetric (B) profiles of the sample “
Higher hydrate
” [4].