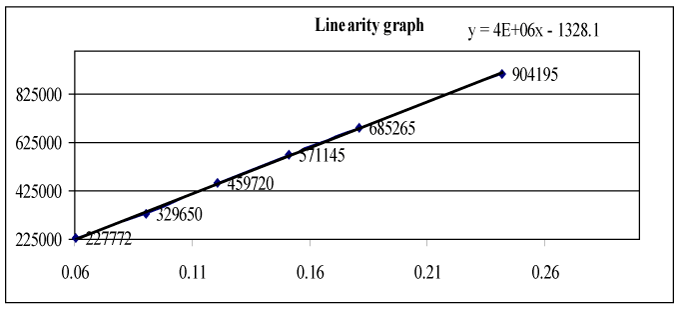
Figure 8:
Linearity graph for Ethinyloestradiol.