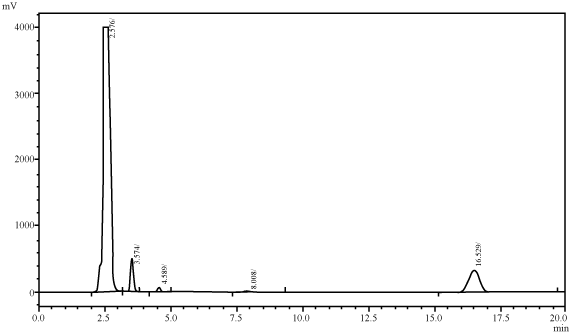
Figure 7:
Typical Chromatogram of H
2
O
2
treated sample.