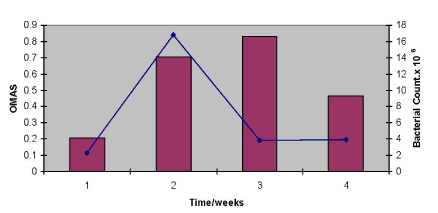
Figure 36:
The relationship between bacterial count and OMAS score at the studied time. The bars represent OMAS and the line represents the bacterial count.