 |
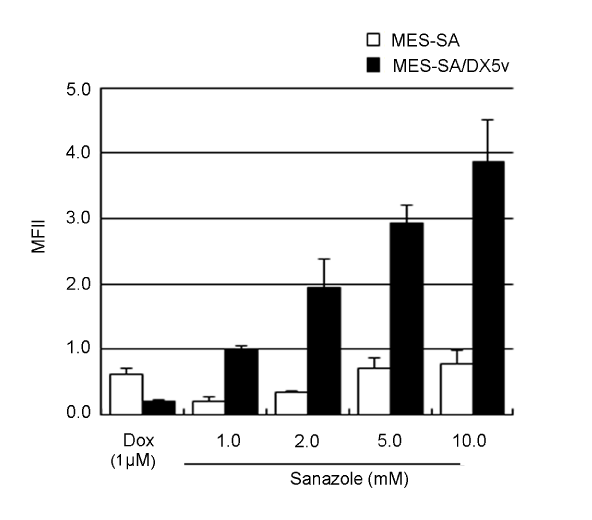
| Figure 5: H2AX phosphorylation. The mean fluorescence intensity (MFI) of labeled γH2AX in control and treated MES-SA and MES=SA/DX5v cells was detected flow cytometrically 24 h after treatment. Dox (1 μM) was used as a positive control. For quantification of data, the mean fluorescence intensity index (MFII) was calculated as follows: (MFI of treated cells – MFI of control cells) / MFI of control. |