 |
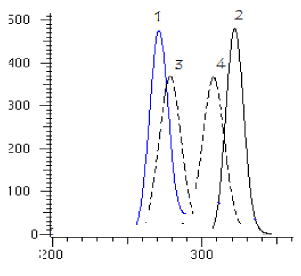
| Figure 6: Fluorescence spectra of: (1,2) spectra of ATM (2 μg/mL) in 3.5 mM SDS in aqueous solution. (3,4) spectra of its acid- induced degradation products (2 μg/mL) in 3.5 mM SDS in aqueous solution. Where: (1,3) are excitation spectra, (2,4) are emission spectra. |