 |
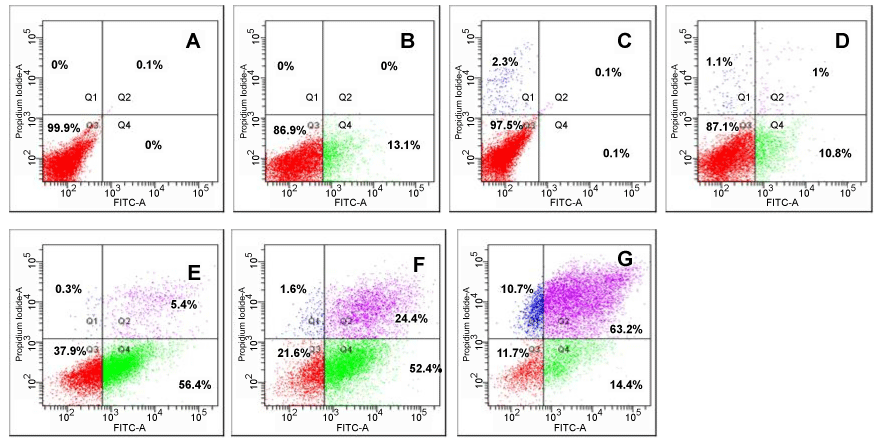
| Figure 5: Induction of apoptosis by F. solani organic extract and confirmation by AnnexinV-FITC/PI dual staining. HeLa cells were treated with 5 μg/mL (E), 10 μg/mL (F) and 25 μg/mL (G) of F. solani organic extract for 24 h and analysed using BD FACScan flow cytometer as described in Materials and Methods. A, B, C and D represent experiment controls of untreated cells alone, untreated cells+AnnexinV-FITC, untreated cells+PI and untreated cells+ AnnexinV-FITC+PI, respectively. Normal healthy, early apoptotic, late apoptotic and dead/necrotic cell populations are shown as percentage of total cells in the quadrants Q3, Q4, Q2 and Q1, respectively. |