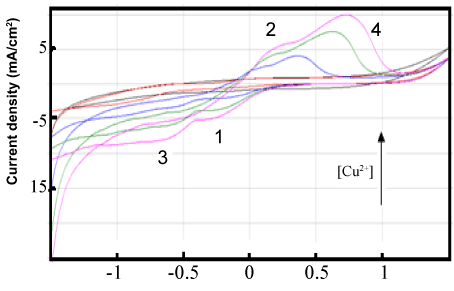
Figure 6:
Cyclic voltammograms obtained by (MO=molecule C)- CPEs at 100 mV/s for different concentrations of copper, in buffer solution