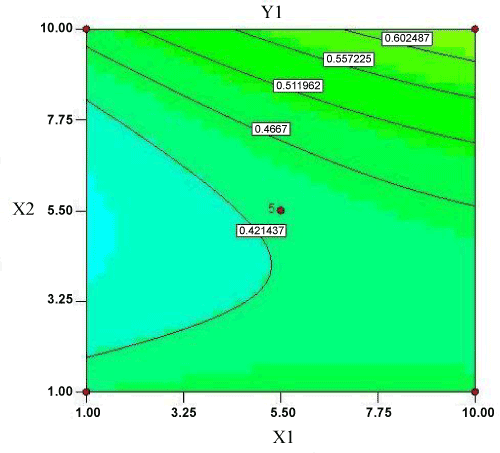
Figure 1a:
Contour plot showing the effect of amount of FC-reagent (X
1
) and sodium carbonate (X
2
) on response (Y
1
).