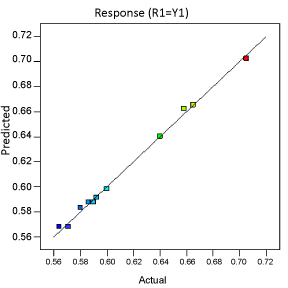
Figure 2:
Linear correlation plots between actual and predicted values.