 |
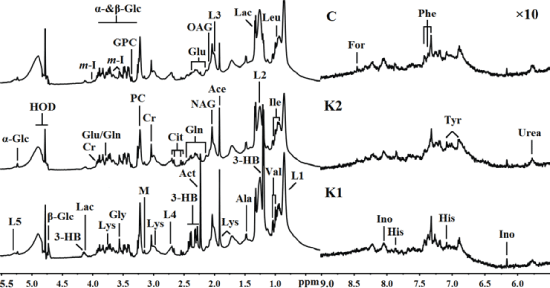
| Figure 1: Representative 600 MHz CPMG 1H-NMR spectra (δ0.5–5.5 and δ5.5–9.0) of samples obtained from groups K1, K2, and C. The δ5.5-9.0 region was magnified 10 times relative to the corresponding δ0.5–5.5 region for the purpose of clarity. 3-HB: 3-Hydroxybutyrate; Ace: Acetate; Act: Acetone; Ala: Alanine; Cit: Citrate; Cr: Creatine; For: Formate; Gln: Glutamine; Glu: Glutamate; Gly: Glycine; GPC: Glycerolphosphocholine; His: Histidine; Ile: Isoleucine; Ino: Inosine; L1: LDL&VLDL, CH3-(CH2)n-; L2: LDL&VLDL, CH3-(CH2)n-; L3: Lipid, -CH2-CH=CH-; L4: Lipid, =CH-CH2-CH=; L5: Lipid, -CH=CH-; Lac: Lactate; Leu: Leucine; Lys: Lysine; m-I: myo-Inositol; NAG: N-acetyl glycoprotein signals; OAG: O-acetyl glycoprotein signals; PC: Phosphocholine: Phe: Phenylalanine; Tyr: Tyrosine; Val: Valine; α-Glc: α-Glucose; β-Glc: β-Glucose. |