aSignificantly different from the ND group at p<0.05 (unpaired t-test).
bSignificantly different from the HFD group at p<0.05 (Dunnett’s multiple comparisons test.
 |
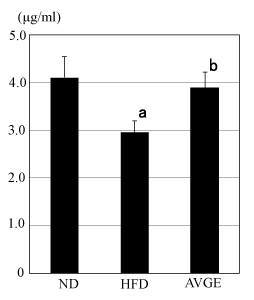
| Figure 4: Plasma HMW adiponectin levels. HMW adiponectin levels were
significantly lower in the HFD group than in the ND group, but were significant
higher in the AVGE group than in the HFD group. aSignificantly different from the ND group at p<0.05 (unpaired t-test). bSignificantly different from the HFD group at p<0.05 (Dunnett’s multiple comparisons test. |