 |
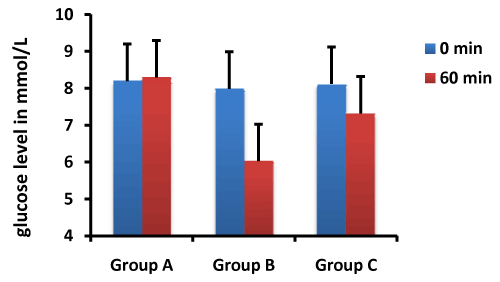
| Figure 4: Mean blood glucose level at 0 minute and 60 minutes of administering saline water (group A), Metformin (group B) and MC-1 (group C) in STZ induced diabetic rats. The standard deviations are shown as error bars. The decrease in glucose lowering level in MC-1 group (group C) was statistically significant (p ≤ 0.05) in comparison to the Metfortmin group (group B) after 60 minutes. |