 |
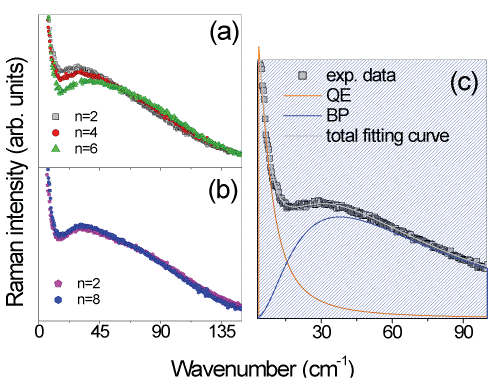
| Figure 1: Cross-polarized Raman intensity of dry samples of a-CDEDTA1n (n = 2, 4, 6) (a) and g-CDEDTA1n (n = 2, 8) (b) nanosponges in the low-frequency range 0 ÷ 150 cm−1. (c) Typical example of the best fitting results for a-CDEDTA12: the experimental data (grey squares) are reported together with the total fitting curve and the different components (QE, quasi-elastic; BP, boson peak). |