|
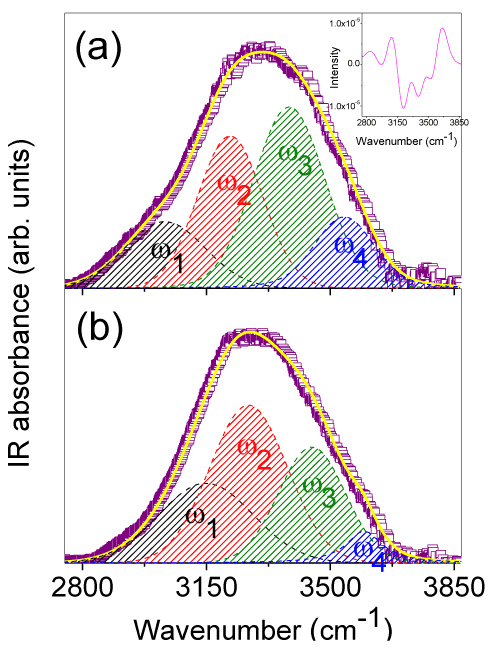
| Figure 5: Example of best curve-fitting result of the O-H stretching profile of water for -CDEDTA12 hydrogel at h = 5.0 (a) and h = 16.2 (b). Experimental data (empty squares) are reported together with the total best-fit (continuous line) and the decomposition components (dashed lines). In the inset of the (a) plot, the second derivative profile of the experimental spectrum of γ-CDEDTA12 hydrogel at h = 5.0 is reported as example. |