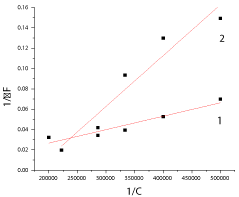
Figure 6:
Double reciprocal plot (1- no containing CTAB : LVFX: 2.7×10
-5
mol/L;2- containing CTAB: LVFX: 2.7×10
-5
mol/L, CTAB: 1.37×10
-3
mol/L)