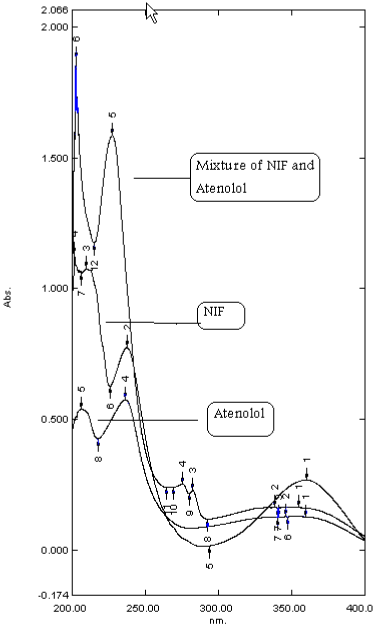
Figure 2:
Absorption spectrum of nifedipine and atenolol showing the spectra overlapping.