 |
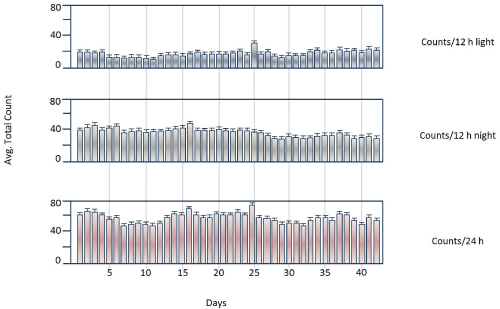
| Figure 2: The figure demonstrates the stability of the baseline activity recorded from adult SD male rats (N=8) over 42 sequential days. The upper (A), middle (B) and lower (C) histograms sum the total activity during the light period (12 hrs), during the light period and during 24 hours respectively. In D is the weekly total activity for six consecutive weeks. The figures demonstrate the stability of the measurement with minor non-significant fluctuations as expected. |