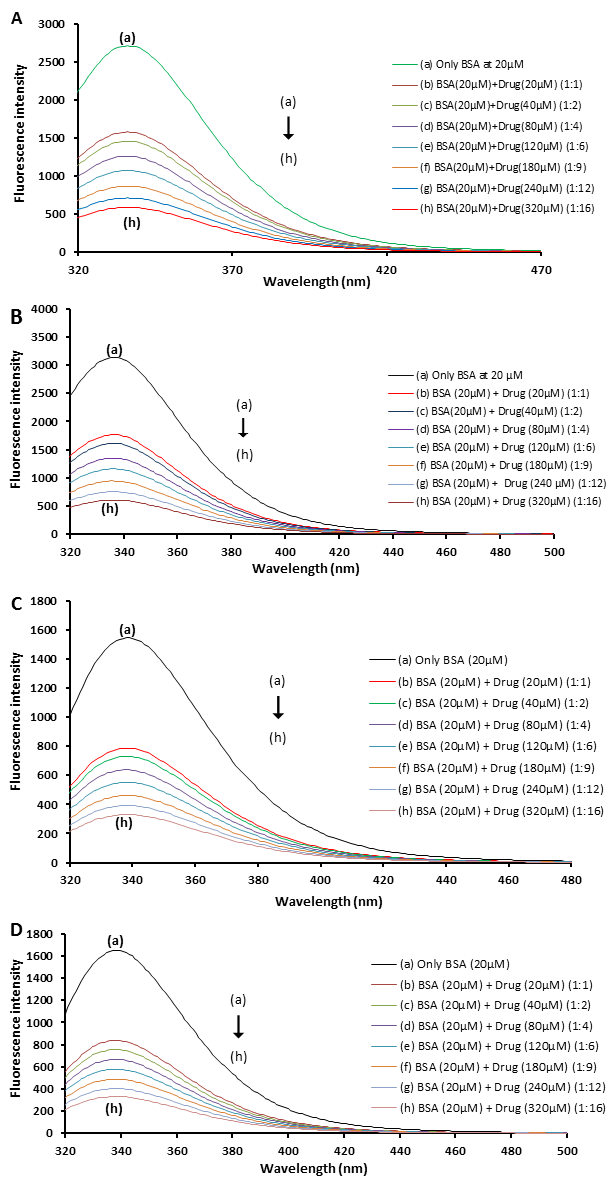
B. BSA fluorescenc spectra in the presence of olanzapine, λex= 280 nm, CBSA= 2x10⁻⁵ mol L-1 ; molar ratio of drug to protein is 0, 1, 2, 4, 6, 9, 12, 16 μM [from (a to h)] at 308 K , pH=7.40.
C. BSA fluorescenc spectra in the presence of olanzapine, λex= 293 nm, CBSA= 2x10⁻⁵ mol L-1 ; molar ratio of drug to protein is 0, 1, 2, 4, 6, 9, 12, 16 μM [from (a to h)] at 298 K , pH=7.40.
D. BSA fluorescenc spectra in the presence of olanzapine, λex= 293 nm, CBSA= 2x10⁻⁵ mol L-1 ; molar ratio of drug to protein is 0, 1, 2, 4, 6, 9, 12, 16 μM [from (a to h)] at 308 K , pH=7.40.