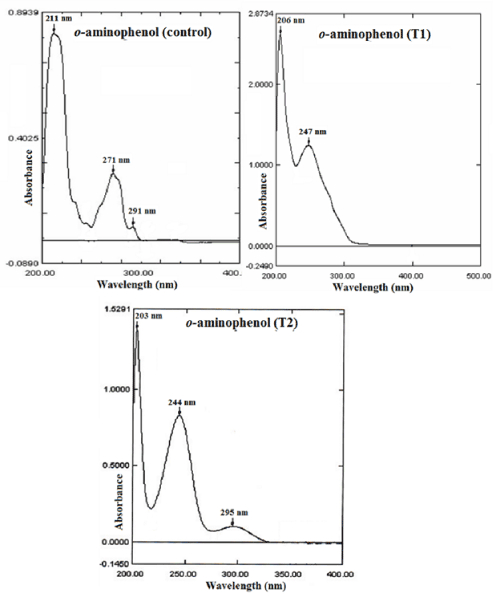
Figure 7:
UV visible spectra of control and treated (T1 and T2)
o
-aminophenol.