 |
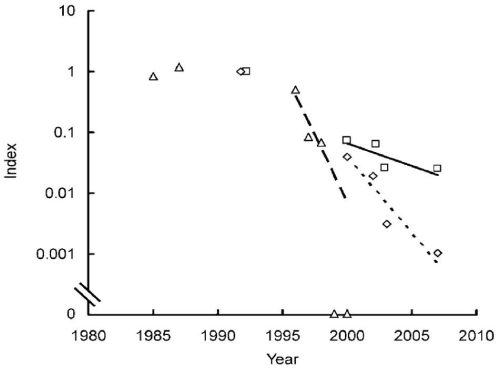
| Figure 3: Declining populations of Gyps vultures in India reproduced from Pain et al. [17]. Points show population size index values on a logarithmic scale plotted against calendar year, which depicts the population as a proportion of its initial size. Triangles represent the number of active Gyps bengalensis nests in Keoladeo National Park, from Prakash et al. [36], expressed as a proportion of the average number in the 1980s. Indices of population size, relative to 1992, of G. bengalensis (diamonds) and G. indicus and G. tenuirostris combined (squares) in northern India were calculated from road transect count data as described by Prakash et al. [37]. Lines depict fitted log-linear regression models (the dashed line represents 5 G. bengalensis at Keoladeo; the dotted line represents 5 G. bengalensis from road transects, and the solid line represents 5 G. indicus/tenuirostris from road transects). |