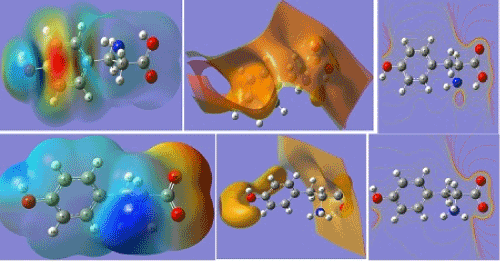
Figure 7:
Total density mappings, MEP mappings and MEP arrays of isolated species (upper) and zwitterion of L-TYR.