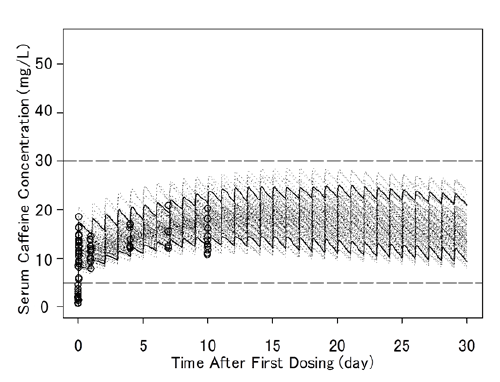
The dotted, zigzag lines indicate randomly simulated concentration changes in 100 neonates, the upper and lower bold lines are the 95% and 5% values, respectively, ○ is the actual measured caffeine concentration, the bold zigzag lines are the therapeutic range (lower 2 lines) and the lower limit of the toxic range (upper 1 line).