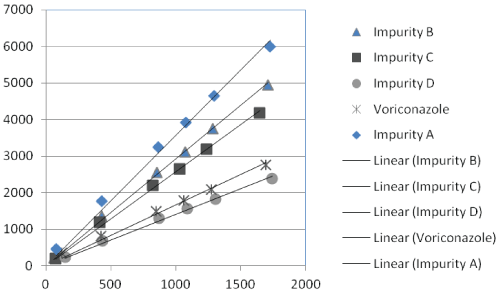
Figure 3:
Graphical representation of regression plot.