 |
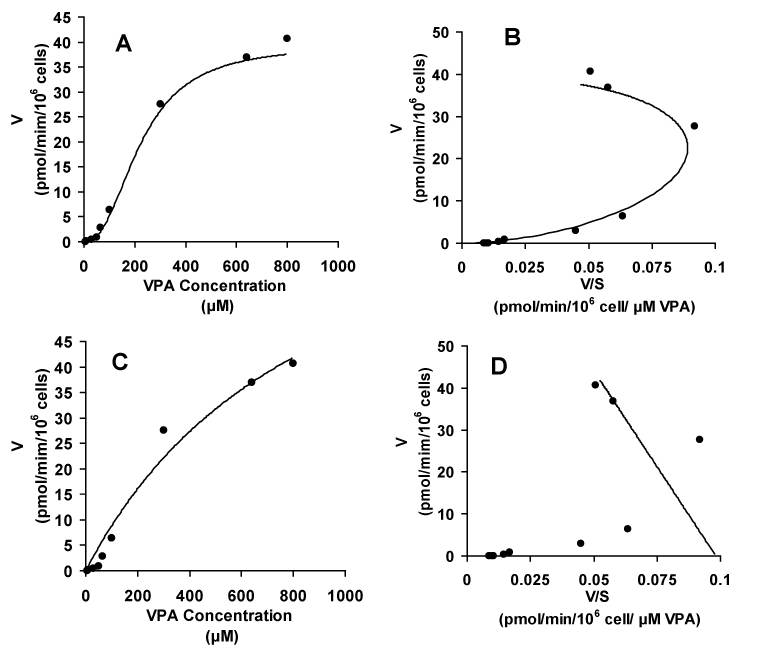
| Figure 1: Plot of VPA-glucuronide formation rate vs VPA incubation concentration and a Eadie-Hofstee plot from a representative human hepatocyte (pool of 10) experiment fitted to the Hill (A and B) or Michaelis-Menten equation (C and D). V is defined as the rate of valproic acid-glucuronide formation and S is defined as substrate (VPA) concentration in the figure. |