|
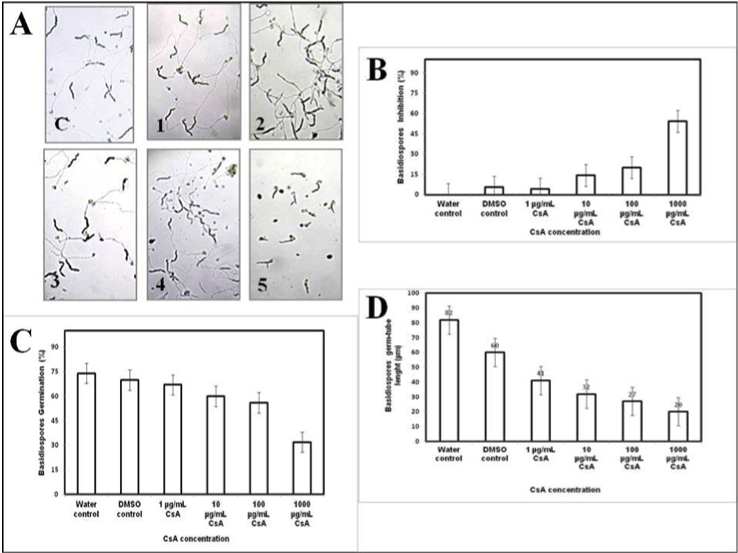
| Figure 6: Inhibition of germination and germ tube development. A- Figure of basidiopores germination inhibition by CsA at different concentrations. C- control without CsA and DMSO; 1- control in the presence of 1% DMSO; 2- 1 μg.mL-1 CsA; 3- 10 μg.mL-1 CsA; 4- 100 μg.mL-1 CsA; 5- 1000 μg.mL-1 CsA. All CsA solutions were done in 1% DMSO. B- Inhibition of CsA on basidiospore germination. C- Basidiospore germination after exposure to CsA. D- Effect of CsA on germ tube development after exposure to CSA. B, C and D - Each bar represents the mean of three independent replications of the experiment with three plates per experiment, and the error bars represent standard deviations. |