 |
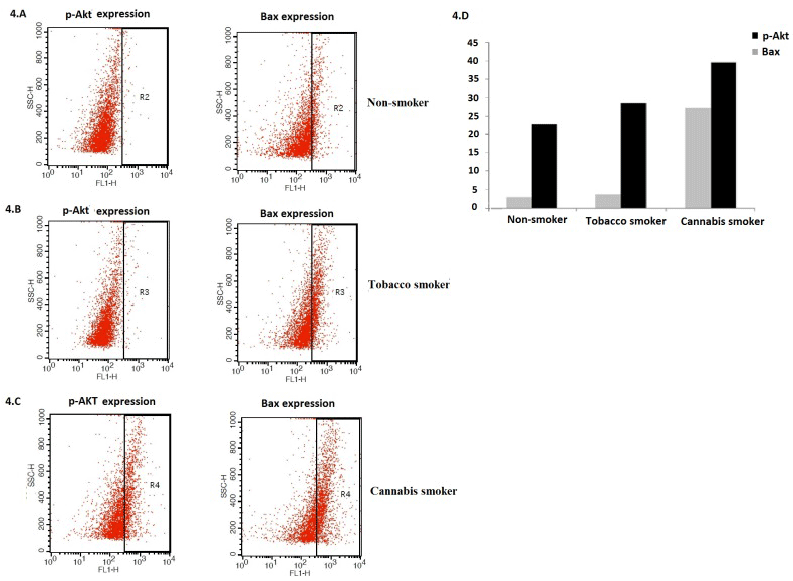
| Figure 4: Analysis of p-Akt and Bax protein expressions in Non-smoker, Tobacco smokers and Cannabis smokers: Forward-angle light scatter (FSC) versus side-angle light scatter (SSC) dot plots obtained by flow cytometry is represented here. The gates used to select the events for subsequent Alexa fluor 488 analyses and were determined depending on the event position in the dot plot, related with its FSC versus SSC. A. Non-smoker subjects showing 25.5% Bax positive sperm cells and only 3.5% p-Akt positive cells. B. Subjects addicted to tobacco smoke showing 32.1% Bax positive sperm cells and only 4.2% p-Akt positive cells C. 44.6% Bax positive and 30.5% p-Akt positive sperm cells were observed in cannabis smokers. D. A graph showing relative expressions of Bax and p-Akt proteins in three groups of subjects by flow cytometry. |