 |
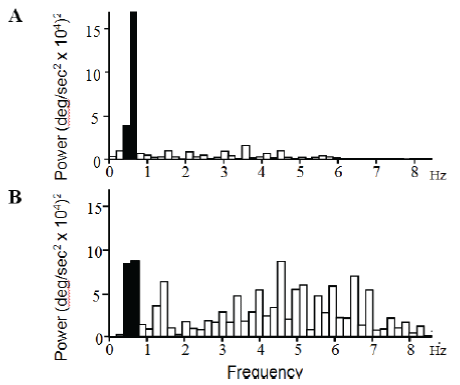
| Figure 3: Power Spectrum (Fourier transform) of accelerations profiles – individual data, A: Healthy subject following the pace of a metronome set on the average speed of PD subjects; B: Parkinson's subject, Bin size, 0.15 Hz. Black columns; bins at and around the movement frequency. |