 |
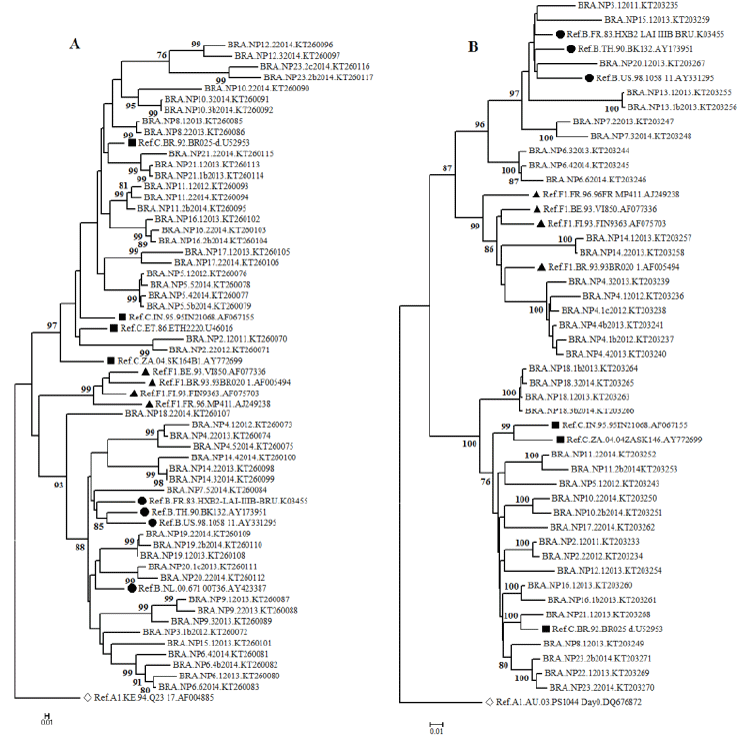
| Figure 3: Maximum likelihood phylogenetic trees for the env (A) and pol HIV genes (B) from LTNP patients. Reference sequences were obtained from the Los Alamos National Laboratory database (http://www.hiv.lanl.gov) and are shown as arbitrary symbols. Numbers at branch nodes refer to the bootstrap support (only values greater than 75% are shown). Bar, 0.1 nucleotide substitutions per site. |