 |
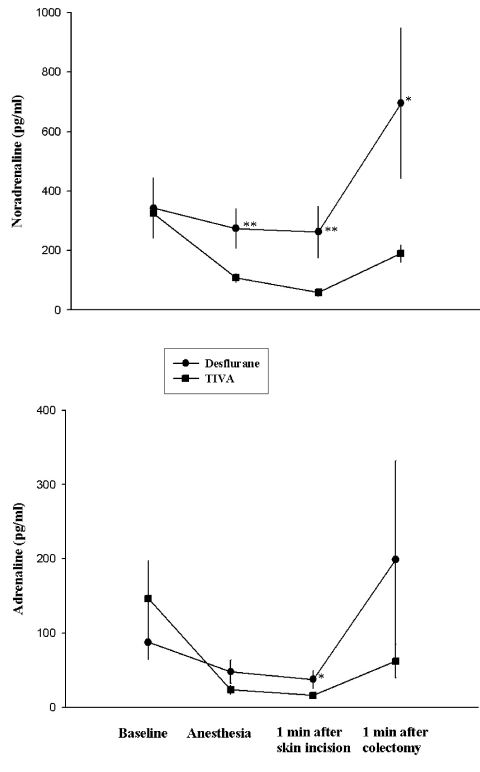
| Figure 2: Plasma noradrenaline and adrenaline concentrations in pg/ml in the TIVA-group and the desflurane-group before anesthesia (baseline) and throughout the procedure. Data are meanąSEM. pg: picogram. TIVA: Total intravenous anesthesia. *: P<0.05. **: P<0.01. |