 |
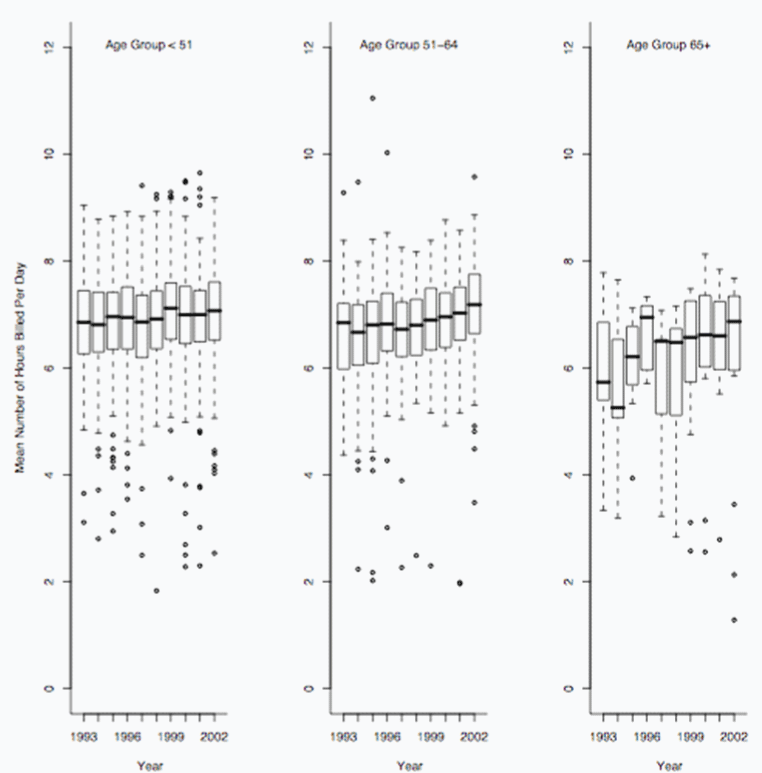
| Figure 3: Box plots for the mean number of hours billed per day for each British Columbia anesthesiologist, in each year of the study, stratified by age groups. The dark solid line represents the median among all physicians for that year, and the upper and lower lines of the box represent the 25th and 75th percentiles. The lines extending from the boxes show the range 1.5 times the interquartile range (IQR) or stop at the maximum value if this is less than 1.5 times the IQR. Outlying data points are shown as circles. |