 |
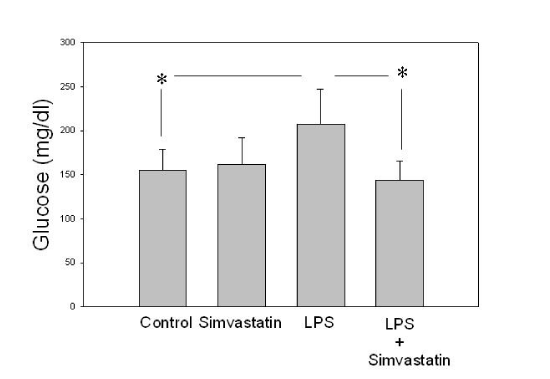
| Figure 3: Glucose levels after simvastatin and LPS treatment. Glucose evels were determined after the treatment with simvastatin, LPS or LPS with simvastatin as described above. The data is an average of 3 experiments with 8 mice in each group. The differences between control and LPS, and LPS X LPS+ simvastatin were statistically significant (*). |