 |
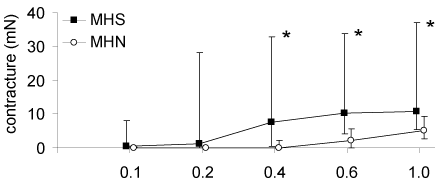
| Figure 1: Contracture development following cumulative administration of dibucaine in concentrations of 0.1, 0.2, 0.4, 0.6, and 1.0 mM in skeletal muscle specimen of malignant hyperthermia-susceptible (MHS, n=8) and normal (MHN, n=8) swine. The value “0” refers to the last contracture before the application of 0.1 mM dibucaine. Dots and squares, respectively, indicate medians; error bars illustrate ranges. Intergroup difference: *P <0.05 |