 |
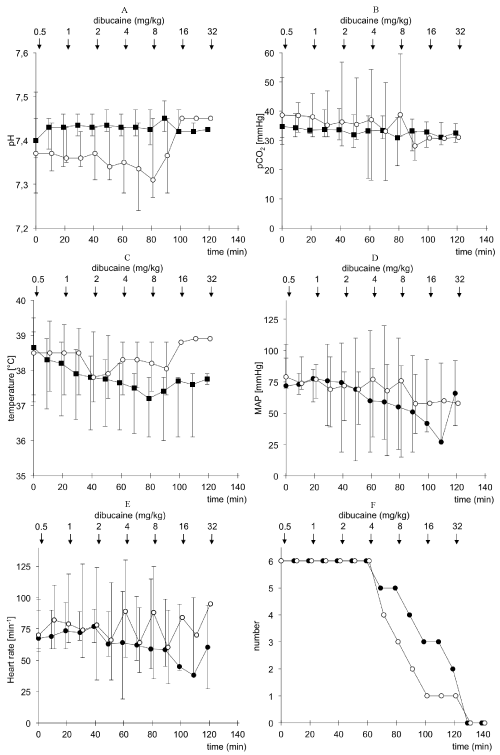
| Figure 3: Course of pH (a) paCO2 (b), rectal body temperature (c), mean arterial pressure (MAP) (d), heart rate (e), and number of animals alive (f) during cumulative administration of dibucaine in concentrations (0.5 -1 - 2 - 4 - 8 - 16 - 32 mg/kg) in 6 MH susceptible (MHS, squares) and 6 MH normal (MHN, dots) swine. The value “0” refers to the steady-state condition before the administration of 0.1 mM dibucaine. Dots and squares, respectively, indicate medians; error bars illustrate ranges. Intergroup difference: *P < 0.05 |