 |
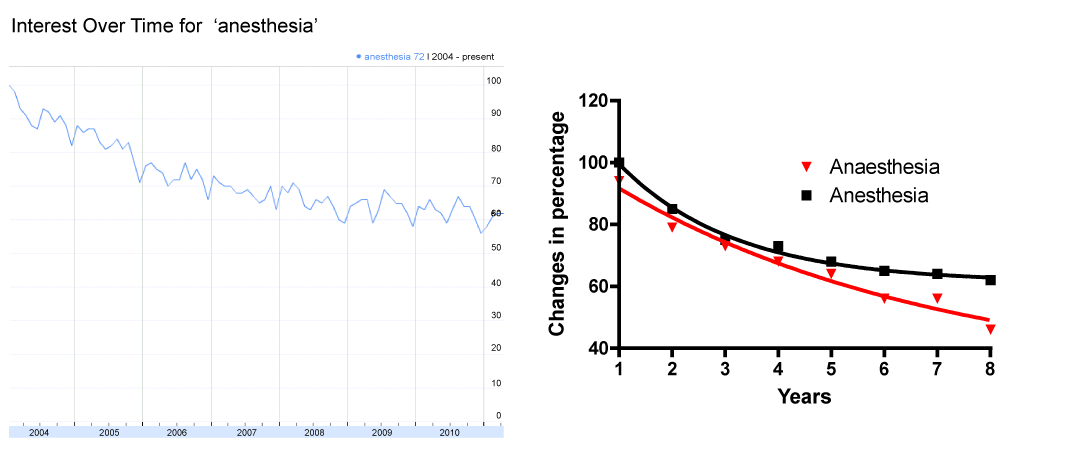
| Figure 1: Proportional measures of frequency that the search term “anesthesia” was entered by users at the main google search page (www.google.com) over the time period 2004 – 2010 (X axis). Each measured time point is expressed as a normalized percentage of the search frequency (Y axis). Note the steady decrease in both of these searches over time. Left panel is the screen shot from the authors’ computer using Google Insights for Search (http://www.google.com/insights/ search/#; accessed: April 30, 2011). Right panel is the graph generated using the numeric data obtained from the Google server. Y axis represents the normalized percentage of the search frequency in January of each year, and X axis represent each year starting year 1 for 2004. A clear exponential decrease is demonstrated for both “anesthesia” and “anaesthesia” as keywords. |