 |
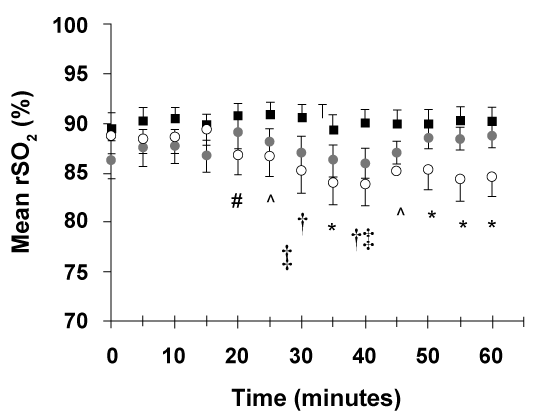
| Figure 1: Tissue oxygen saturation (rSO2) over time Mean rSO2 values are depicted. Zero minutes represents baseline measurements. Values are means +/- standard deviation. Closed squares represent non-blocked limb rSO2, open circles represent blocked limb rSO2, and grey circles represent cerebral rSO2. #P<0.0001 vs. time matched non-blocked limb values; *P<0.0001 vs. all time points in non-blocked limb; †P<0.0001 vs. 5, 15, 20, 25, and 35 minute values in non-blocked limb; ‡P<0.0001 vs. 60 minute time point values in non-blocked limb; ^P<0.0001 vs. 15, 20, 25, and 35 minute values in non-blocked limb. |