 |
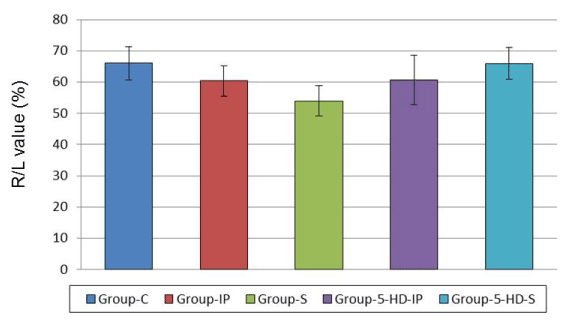
| Figure 2: The figure shows R/L value (%), which means the area at risk expressed as percentage of left ventricle. Data are expressed as mean ± SEM. Area at risk revealed no significant difference among all groups, suggesting that the changes in the infarct size observed among the groups did not depend on R/L. Group-C: a control group (n=9). Group-IP: a ischemia-preconditioned group (n=10). Group-S: a sevoflurane-preconditioned group (n=6). Group-5- HD-IP: a group which was given 5HD 10 min before ischemic preconditioning (n=6). Group-5-HD-S: a group which was given 5HD 10 min before sevoflurane exposure (n=6). |