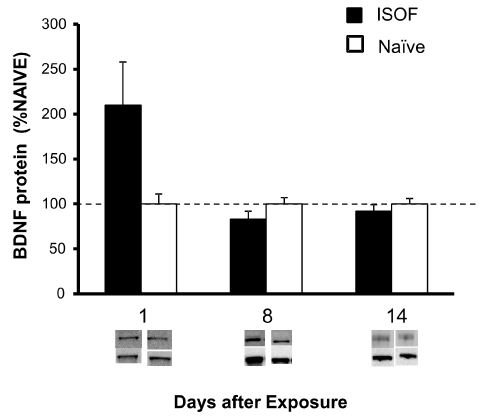
ISOF (black bars) and Naïve rats (white bars) as densitometry units relative to
GAPDH and normalized to Naïve at day 1, 8 and 14 after exposure, ± SEM, n=6
*p<0.05 relative to Naïve; representative blots from Naïve and ISOF are shown.
 |
| Figure 2: BDNF protein. The graph depicts hippocampal BDNF protein levels in ISOF (black bars) and Naïve rats (white bars) as densitometry units relative to GAPDH and normalized to Naïve at day 1, 8 and 14 after exposure, ± SEM, n=6 *p<0.05 relative to Naïve; representative blots from Naïve and ISOF are shown. |