|
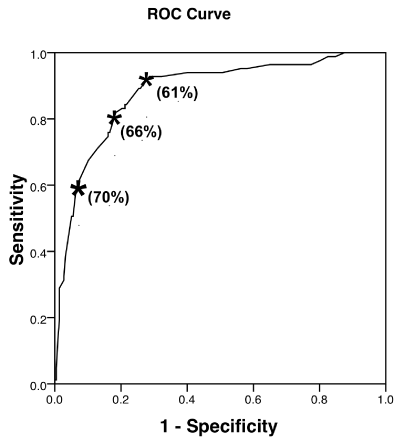
| Figure 3: Receiver operating characteristic (ROC) curve assessing the ability of central venous blood O2 saturation (ScvO2) to predict mixed venous O2 saturation (SvO2) of 70% or more. Area under the curve (AUC) was 0.9, the numbers in bracket indicates different ScvO2 cut-off values. |