 |
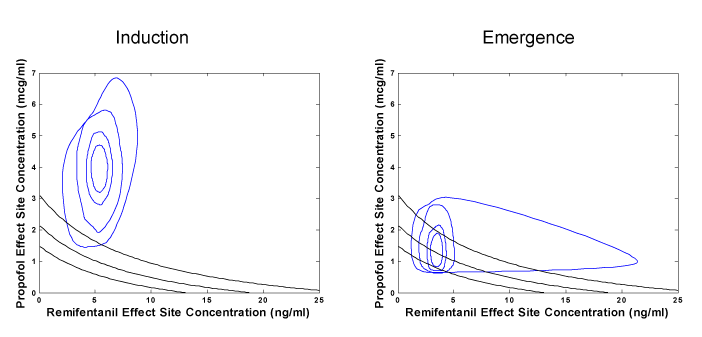
| Figure 2: Topographical view of propofol-remifentanil kinetic model variability superimposed on model predictions of loss of responsiveness at induction (left) and emergence (right). The blue lines present the distribution of prediction variability; the percentage of concentrations from the largest to the smallest are 100%, 99%, 95%, and 68%. The black lines represent the 5, 50, and 95% isoboles for the pharmacodynamic response surface model for loss of responsiveness. |