 |
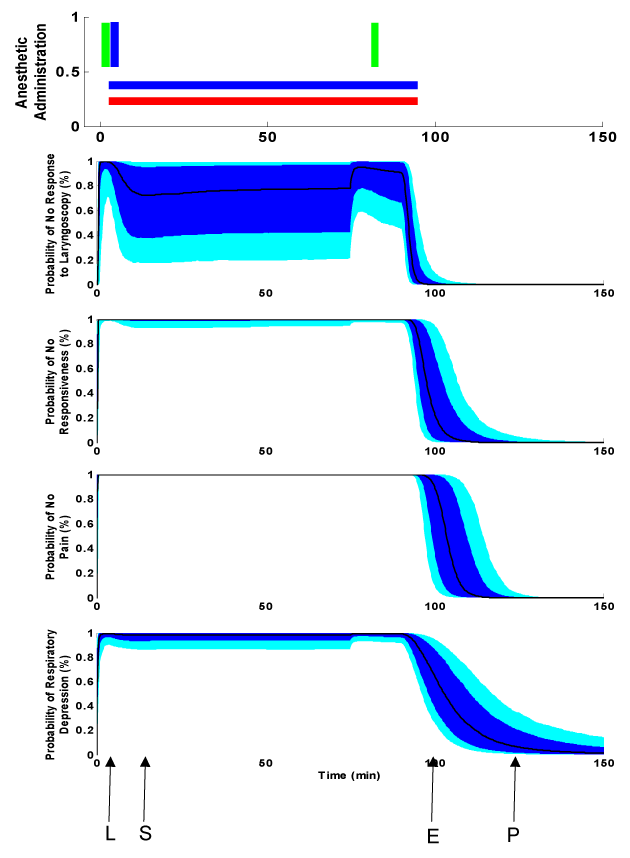
| Figure 3: Pharmacodynamic effect versus time illustrating the dose-response variability of the drug effect relationship of the combined pharmacokinetic/ pharmacodynamic models. The bottom four windows illustrate the distribution of the stimulus response predictions the black line shows the pharmacodynamic prediction, the dark blue shows the middle 68% predictions, and the light blue shows the variance of 95% of the predictions. The four clinical time points of interest are indicated by the black arrows on the bottom figure at the time point of laryngoscopy (L), skin incision (S), emergence (E), and time to enter PACU (P). |