 |
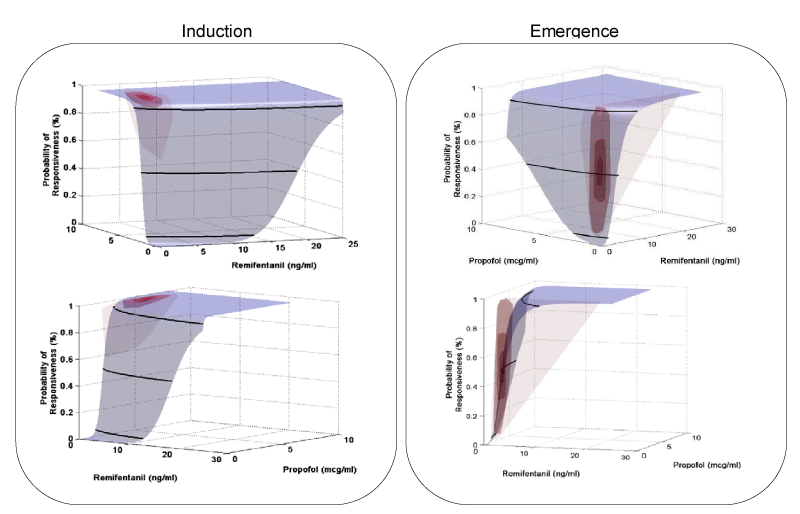
| Figure 4: Pharmacokinetic and pharmacodynamic variability for loss of responsiveness at induction (left) and during emergence (right). For orientation the 5, 50, and 95 % isoboles of the response surface model are shown in black. The response variability of 1000 simulations on the response surface model is represented as a red cloud with cloud shading indicative of the distribution of variability. The shells of distribution calculated were 100%, 99%, 95%, and 68% of the total variability. A front view and a side profile view of the response surface model are shown for each. |