 |
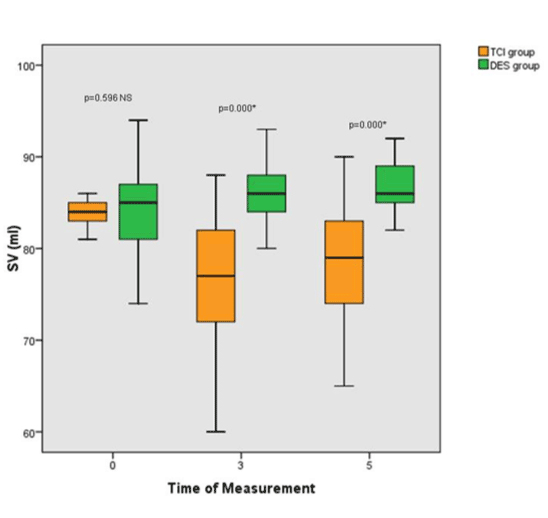
| Figure 3: Box and Whisker plot of Stroke volume (SV) in TCI group and Des group in patients undergoing hepatic resection. Result is expressed as minimum, maximum, median (line within the box) and 25th and 75th percentiles(error bars) are shown at selected time points.TCI: Target Control Prpopofol/Fentanyl Infusion; DES, Desflurane. T0: 15 min after intubation; T3: during dissection and T5: near the end of surgery. P<0.01 considered significant. |