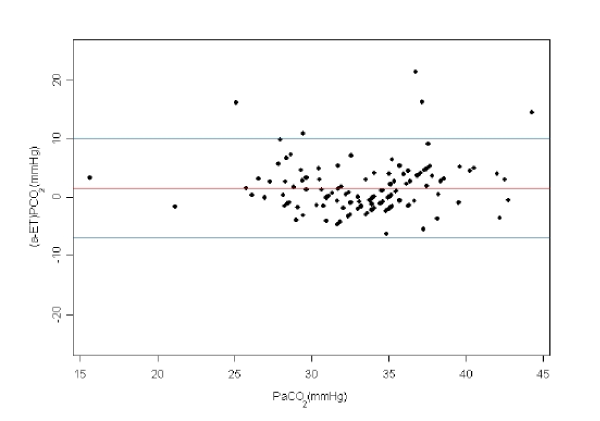
Figure 1:
Bland and Altman plot of difference versus average between (a-ET) PCO
2
(arterial to end-tidal carbon dioxide gradient) and PaCO
2
(arterial carbon dioxide). Mean difference is 1.6 ± 4.33 mmHg (n=129).