 |
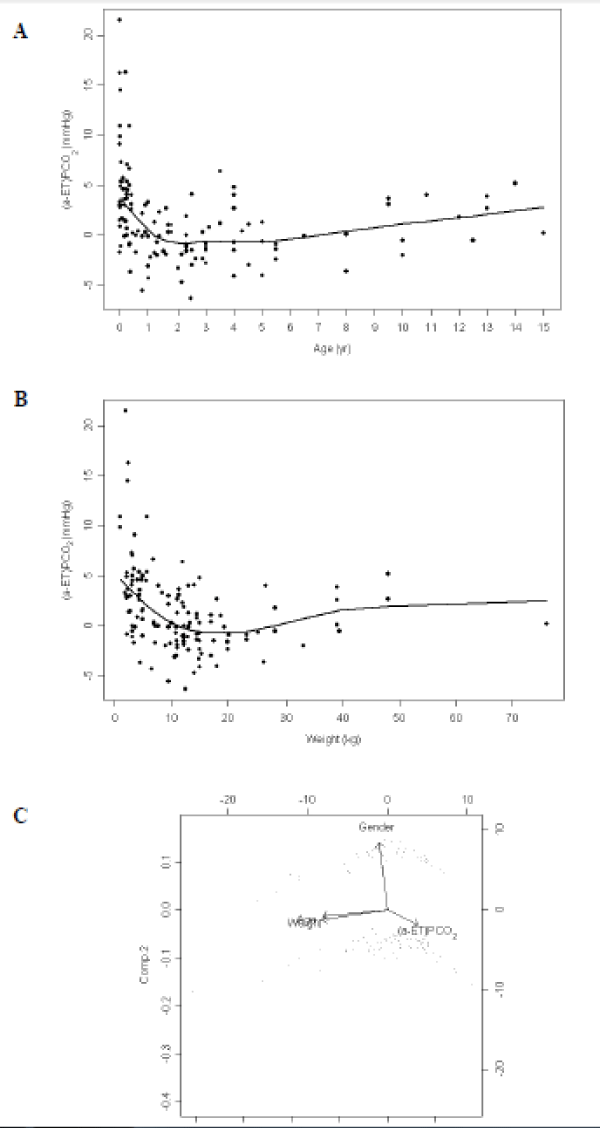
| Figure 3: Relationship between (A) age and (B) weight and (a-ET) PCO2 (arterial to end-tidal carbon dioxide gradient) (n=129). There was a significant correlation between (a-ET) PCO2 and age (r=-0.42, P<0.0001), and between (a-ET) PCO2 and weight (r=-0.44, P<0.0001). These results were confirmed by the multivariate analysis displayed in the (C) biplot graph (coefficient of determination R=0.30) No relationship between (a-ET) PCO2 and gender was detected (P=0.82). Multiple linear regression analysis gave the following relationships: (aET)PCO2=-10=0.41 × PaCO2-0.39×weight+0.00738×weight for females and (aET)PCO2=-7.04+0.4107 × PaCO2-0.802 × weight+0.0078 × weight+0.00263 × age for males. |