 |
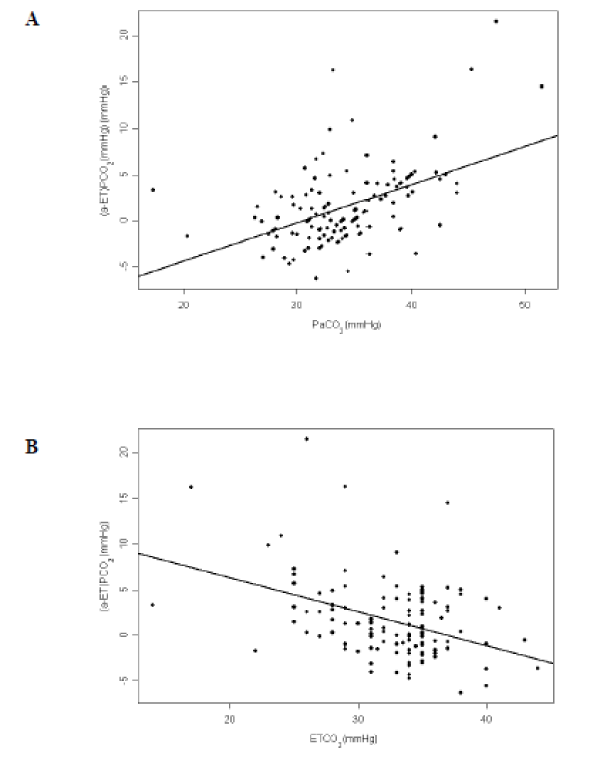
| Figure 4: Relationship between (A) (a-ET) PCO2 (arterial to endtidal carbon dioxide gradient) and PaCO2 (arterial carbon dioxide tension) and between (B) (a-ET) PCO2 and ETCO2 (end-tidal carbon dioxide) (n=129). There was a significant correlation between (a-ET) PCO2 and PaCO2 (r=0.43, P<0.0001) and between (a-ET) PCO2 and ETCO2 (r=-0.31, P=0.0004). |