|
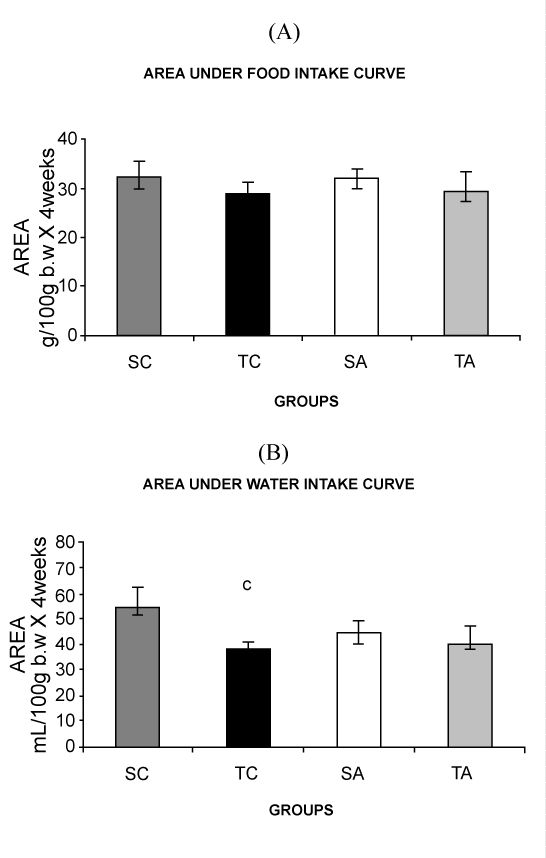
| Figure 2A e 2B: Area under food (A) and water (B) intake curve of the animals from weaning (28 days) and to the end of the experiment (60 days). Results expressed as mean ± standard deviation; n=10 animals per group. SC= Sedentary control; Trained control =TC; Trained alloxan =TA; Sedentary alloxan =SA. (Two-way ANOVA, P <0.05). c = SCx TC. |