 |
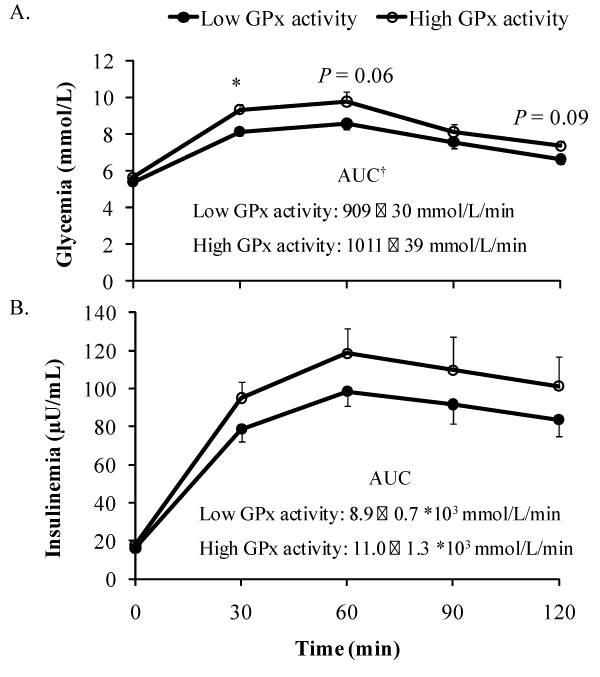
| Figure 2: Glycemia (A) and insulinemia (B) during an OGTT in Low and High GPx activity subjects. Values are presented as mean ± SEM. *Significantly different between groups (P = 0.04). †Significantly different between groups. AUC: Area under the curve. |